 Philippe Gaultier
Philippe Gaultier
Philippe Gaultier
Published on 2023-12-01. Last modified on 2025-07-07.
Is it any good? Can you solve real problems with it?
Most people know Gnuplot as a way to plot data. Two lines of code and we can visualize data:
Gnuplotset output "plot.png" plot "out.dat" with lines
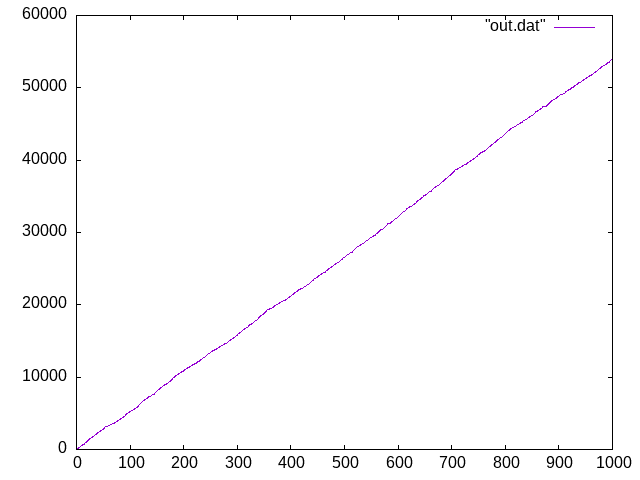
where out.data is a text file with a number on each line.
The software engineering advice that I heard a long time ago and left a mark on me is: Find a way to visualize your problem.
So Gnuplot is definitely worth of a spot in a Software Engineer's toolbox.
However, few know that Gnuplot is actually also Turing complete programming language. It is similar in syntax to Perl or Awk. So I scratched an itch and solved a problem with it.
In short, we get a text file where each line contains random ASCII characters. For each line, we must find the first and last digit characters, combine them into a number and at the end output the sum of all these numbers.
The way we read the data into a variable is through a shell command:
Gnuplotdata = system("cat in.txt")
Gnuplot has the plot command to turn input data into a plot, but nothing built-in to read input data into a variable, it seems. No matter, system which spawns a command in a subshell does the trick.
Since we need to check whether a character is a string, let's define our own little function for it. Yes, Gnuplot has user defined functions! The unfortunate limitation is that the body has to be an expression:
Gnuplotis_digit(c) = c eq "0" || c eq "1" || c eq "2" || c eq "3" || c eq "4" || c eq "5" || c eq "6" || c eq "7" || c eq "8" || c eq "9"
Characters are not a thing; instead we deal with a string of length 1. Comparing strings for equality is done with the operator eq.
Then, we iterate over each line in the data. Gnuplot has a for-each construct we can use for that.
We then iterate over each character in the line with a for-range loop, isolating the 'character' (remember, it's just a string of length 1) with a slicing syntax that many modern languages have:
Gnuplotsum = 0 do for [line in data] { len = strlen(line) do for [i = 1:len] { c = line[i:i] } }
One thing to note here is that strings are 1-indexed and the slicing syntax is: foo[start_inclusive:end_inclusive].
We then set first to the first digit character we find:
Gnuplotdo for [line in data] { len = strlen(line) first= "" do for [i = 1:len] { c = line[i:i] if (is_digit(c)) { if (first eq "") { first = c break } } } }
We do the same for the last character, iterating in reverse order:
Gnuplotlast = "" do for [i = len:1:-1] { c = line[i:i] if (is_digit(c)) { if (last eq "") { last = c break } } }
Finally, we concatenate the two digits (which are still two strings of length 1 at that point) with the . operator, convert it to a number with the + 0 idiom, and increase our sum:
Gnuplotnum = first . last + 0 sum = sum + num
We just have to print the sum at the end:
Gnuplotprint(sum)
Pretty straightforward, isn't it? Well, no. The language is weirdly restrictive, for example sum += num does not parse. for and while loops cannot for some reason be used interchangeably due to the weird do prefix for for-loops. Very few builtin functions are available.
There does not seem to be basic data structures such as arrays and maps. Every variable is global. And so on.
It's weird because the language also has very modern constructs that some mainstream languages still do not have, like the slicing syntax.
Awk, Lua or Perl are honestly better in every way, to pick relatively simple, dynamic languages that people usually reach to for Unixy text transformations. And these will have better tooling, such as a debugger. Heck, even shell scripting is probably easier and more straightforward, and that's a low bar.
Everything points to the fact that Gnuplot expects it's input data in some prearranged tabular form, and just wants to plot it, not transform it. That means that another (real) programming language is expected to do prior work and Gnuplot is at the end of the data pipeline as a 'dumb' visualization tool. I can also see how the limited language can still be useful for Physicists or Mathematicians to write simple numerical, pure functions e.g. f(x) = x*2 + 1.
I'll investigate Julia and perhaps R in the future, which are in the same niche of science/data visualization but are full programming languages with plentiful tooling.
Run with gnuplot my_file.dem.
Gnuplotdata = system("cat in.txt") is_digit(c) = c eq "0" || c eq "1" || c eq "2" || c eq "3" || c eq "4" || c eq "5" || c eq "6" || c eq "7" || c eq "8" || c eq "9" sum = 0 do for [line in data] { len = strlen(line) first= "" do for [i = 1:len] { c = line[i:i] if (is_digit(c)) { if (first eq "") { first = c break } } } last = "" do for [i = len:1:-1] { c = line[i:i] if (is_digit(c)) { if (last eq "") { last = c break } } } num = first . last + 0 sum = sum + num } print(sum)
If you enjoy what you're reading, you want to support me, and can afford it: Support me. That allows me to write more cool articles!
This blog is open-source! If you find a problem, please open a Github issue. The content of this blog as well as the code snippets are under the BSD-3 License which I also usually use for all my personal projects. It's basically free for every use but you have to mention me as the original author.
My views are my own and not those of my employer.